
Table of Contents
The Best Guide for Google Analytics
You have must heard about Google Analytic Reports. Right?
But without reading a Guide for Google Analytics, using analytics would be useless!
Google Analytics is one of finest tools we can use to know statistics about our website. It is divided into five analytic reports, we will start knowing about.
Now the very first report we will see in google analytic reports is:
Overview Guide of Google Analytics
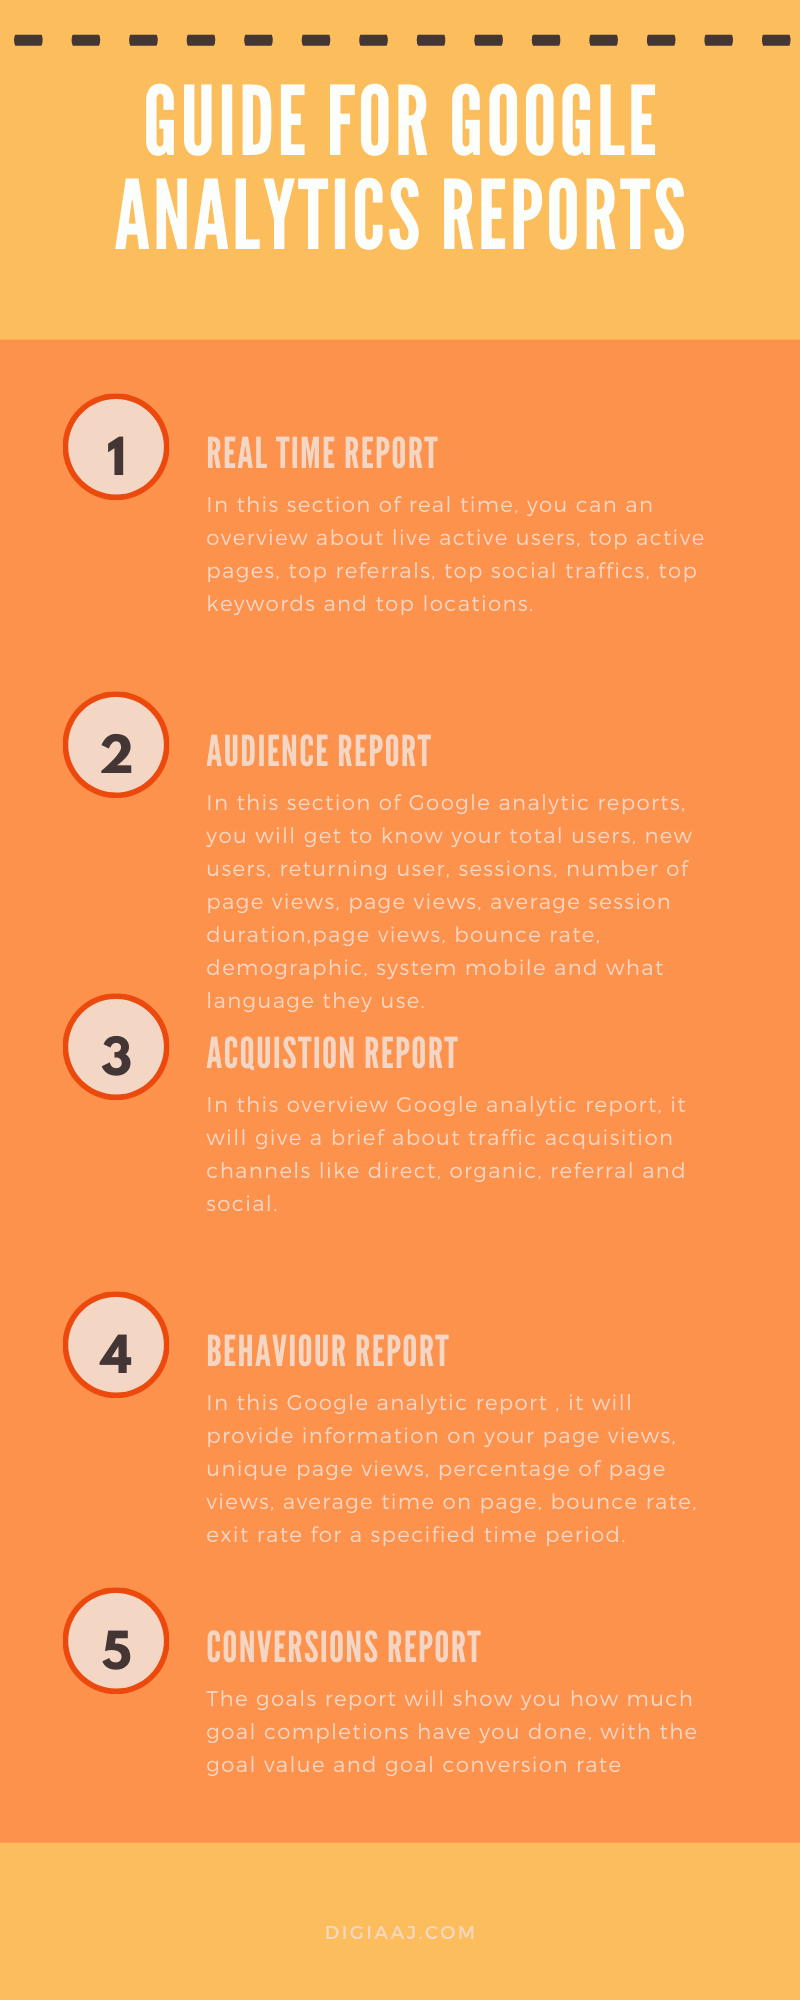
1-Real time Report : Guide for Google Analytic Reports
As the name suggests in the first Google analytic report, it will provide information of what is happening on your website at the present moment. That is cool!!
It has six options:
(a) Overview – In this section of real time, you can an overview about live active users, top active pages, top referrals, top social traffics, top keywords and top locations.
(b) Locations – In this section, you will get to from which country your traffic is coming and how much live is coming from a country.
(c) Traffic sources – In this section you will get to know from which medium and source your traffic is coming and how much live active users.
(d) Content – This report shows which pages your current visitors are spending time on, including the page active URL, the page title and the percent of active visitors that are on each page.
(e) Events – The Events feature in Google analytics allows digital marketers to create custom events for measuring button clicks, video plays downloads, and ad clicks on your website. You can track the top events on your website as that takes place in real time and break down on specific event categories and actions with the Real-Time Events report.
(f) Conversions – In this google analytics guide, a report would be produced showing which goals the visitors are completing.
you can also see the total number and percentage of active users who have completed the goal.
2-Audience report : Guide for Google Analytic Reports
It is one of the top 5 google analytics reports and is 6 sub divided reports
(a) Overview – In this section of Google analytic reports, you will get to know your total users, new users, returning user, sessions, number of page views, page views, average session duration,page views, bounce rate, demographic, system mobile and what language they use.
(b) Active Users- In this Google analytic report, it will give you insights about your unique visitors who have visited your website during time period like – 1 day, 7 day, 14 days and 24 days
(c) Lifetime value – In this Google analytic reports, you will get statistics which is beneficial for eCommerce owners.
It also allows you to compare various different Lifetime Value (LTV) metrics, which includes
Pageviews per user (applies only to website users)
Goal completions per user
Revenue per user
Session duration per user
Sessions per user
Transactions per user
(d) Audiences – Skip it.
(e) Cohort analysis – This Google analytic report will explain you later regarding this one.
It simply means a group of visitors that has similar charactertics.
So far this report groups users with only, “Acquisition Date” its the only “Cohort Type” you can use.
By the way, Acquisition Date is the day a user first visited to your website.
(f) User explorer – In this section of Google analytics report, you will get to know information about a client Id. Client Id is a unique IP assigned to each device.
It will inform you about the bounce rate, average session duration, transactions etc from one specific client id. So, in short, you will assess information on individual visitors rather than an aggregate.
(i) Demographics- In this Google analytic report, there are three sub divided reports:
(a)Overview –An overview about age (age group) and gender (male or female) of your traffic.
(b) Age –Detailed information about the age group of your traffic like it will explain the total users of a age group, its average session duration, bounce rate etc.
(c)Gender – In this google analytics guide
a report would be shown which tells information about the gender of your traffic like it will explain the total users of a gender group, its average session duration, bounce rate etc.
(ii)Interests – It is sub-divided into 4 parts
(a)Overview – It will give you a brief about all Affinity Categories, In- Market Segments and Other Segments.
(b)Affinity Categories – These are those people who are your potential customers as they have general interest in the question
(c)In- Market Segments – These are those people who are ready to purchase in the topic.
(d)Other categories- This category will give you more detailed information about the visitors which the other two categories could answer.
For example – Whether they like music more or food,
(iii)Geo – It is sub-divided in two parts:
(a) Language – In this google analytics guide, you will give you information about the default language which is set by the users in their browsers. Also it will show users, new users, average session, bounce rate and many other things of one language like (en-us)
(b) Locations – It will show your traffic from different countries and showing information on users, new users, average session, bounce rate and many other things from one country.
(iv)Behaviour – It is sub-divided into 3 parts
(a)New Vs Returning Users – In this google analytics guide you will see information on your total new users and returning from the selected range. Some other information about average session, bounce rate of new and returning users.
(b)Frequency & Recency – In this analytic report you will learn information on how much count of sessions have occurred. For example – Count of sessions is 1 and the number of users are 200, so this fall in count of session 1 = 200.
(c)Engagements – It will explain the length of sessions of visitors.
For example, session duration is 0 to 10 and the number of visitors is 10 ,who have spend 0 to 10 seconds on your website will come under the session of 0 to 10.
(v)Technology- It is further divided into two parts:
(a)Browser & OS –This will give reports of visitors, on which browser they use like UC browser, chrome, internet explorer etc.
(b) Network – In this Google analytic report you will get information on which companies they choose for their internet service provider or in normal terms which SIM card they are using like Airtel, Vodafone, Idea, etc.
(vi)Mobile – It is further divided into two categories:
(a) Overview –This will give report on your which devices your visitors use like desktop, tablet or smartphones.
(b)Devices – This will give information about the model name of the device like Apple 8, Google Nexus 5.
(vii) cross device – Skip it.
(viii)custom- It is the most useful google analytics reports, where you can create your own reports by choosing your variables and metrics. Do not touch if you no idea about coding just likes me.
(x)Bench-marking- In this google analytics guide, you can see information about your website’s overall performance by comparing it to your competitors. You just have to enable bench-marking.
(g) user flow – In this Google analytics report , you will get information of your visitors, like a flow of process. It will show the path, the visitors go after coming to the landing page. For example, they have visit, page 1 then page 3 and then 7.
3-Acquisition report : Guide for Google Analytic Reports
It will provide a summary of acquisition, behaviour and conversion report on the basis of 4 marketing channels
it used to determine which marketing send the maximum quality traffic which can led to conversions.
(a) Overview- In this overview Google analytic report, it will give a brief about traffic acquisition channels like direct, organic, referral and social.
(b) All traffic – It is divided into four parts:
(i) Channels – In this google analytics guide you see information about the visitors of 4 different channel groupings (organic, direct, referral and social) like users, total users, bounce rate etc. If your further click on them you can see the landing pages through which visitors came to your site from the different channels.
(ii)Tree maps – it shows the flow of your users by grouping them into channels.
(iii)source/medium – In this google analytics guide you see will information about your traffic from which source and medium they come.
Now, source is the place where your traffic was already present before seeing your content and the medium refers to the way they reach your website.
For example, 1 visitor came to your site using search engine, so the source is Google and the medium would be organic.
(iv)referrals – In this Google analytic report, you will get more details about the referral traffic of your website like users, new users, bounce rate, average session duration etc.
(c) Google ads – This reports gives full details on adwords, which means traffic coming to your site through ads.
(i) Campaigns – This report let you have a proper information on how well your ad campaigns are working. You can see total clicks, cost and ctr.
(ii)Tree-maps – It shows you the path of the traffic which came to your site when they clicked on your ads.
(iii)site-links – It tells you, how each site-link extension in your Google ad account has performed.
(iv)Bid adjustments – It helps you analyze your Google Ads performance for each of the bid adjustments (Devices, Locations, and Ad Schedule) you have set for your ad campaigns.
(v) Keywords – Those keywords on which you have bid to appear it on search engines. It shows well keywords are doing.
(vi)Search Queries – Actual phrases or sentences users searched before clicking on your paid ad on search engines like Google or Bing.
(vii)Hour of day – this report give you statistics on the basis of hours of day.
(viii)Final URLS – This report provides you information on the last URL or web-page a visitor was before the conversion.
(ix)Display targeting – This report gives information on how well your display adword campaigns are working on the display network of google.
(x)Video campaigns – In this Guide for Google analytic report shows you statistics of your video ads.
(xi)Shopping campaigns – In this Guide for Google analytic report you will see information on how well your campaigns are performing after users click on your Shopping Campaigns ads.
(d) Search console – An overview of your SEO efforts is shown in this analytic report.
(i) Landing pages – Landing page is the page visitors enters your website.
(ii)Countries –This report will provide more information about the country from which traffic originating.
(iii)Devices- This Google analytics report provides information from devices your visitors use like desktop, tablet or smartphones. Like impressions, CTR, clicks etc.
(iv) Queries- This Google analytic reports is worth examining.
In this Guide for Google analytic report you can see queries.
This report will provide you information about the actual or original query via google or search engines which has generated a session or because which visitors came to your website.
(e) Social –
(i)overview – In this overview google analytics report, it offers
a quick summary of sessions and conversions generated from various social channels with breaking down each channels.
(ii) Network Referrals- In this Guide for Google analytic report, a statistics will be provided.
A report on which social network like Facebook, instagram etc where the social activity originated.
(iii)Landing Pages- Now these are the landing pages that you shared on social networks and from there a social activity originated from a specific social networking site.
(iv) Conversions – it shows reports on monetary value from the traffic which a social network has generated.
(v)Plug-ins – social plugins like Facebook or Twitters buttons allow visitors to share content on their social networks profiles. This report gives statistics on what content is being shared and where.
(vi)Users Flow- This user flow will give you information about the user flow of social network traffic. For example, facebook they have visit, page 1 then page 3 and then 7.
(f) Campaigns –
(i)all campaigns – It tracks the visitors who have come to your website from the campaign that you have set up. It uses UTM tracking code.
(ii)Paid Keywords -Those keywords that brings traffic through search engines’ ad networks like Google AdWords or Bing Ads.
(iii)Organic Keywords – Those keywords that brings traffic from search results in search engines like Google, Yahoo and Bing. Organic means that your website appeared in the search results, not because you paid for it.
(iv)Cost analysis – The Cost Analysis report allows you to measure sessions, costs and revenue performance for paid advertising campaigns.
4-Behaviour Report : Guide for Google Analytic Reports
This report will offer you information on how your website’s traffic common behaviour is.
Let’s have a closer look at it.
(a)Overview – In this Google analytic report , it will provide information on your page views, unique page views, percentage of page views, average time on page, bounce rate, exit rate for a specified time period.
(b)Behaviour Flow –In this Guide for Google analytic report it shows you the flow!
The flow of visitors after they land on a landing page. It shows the first page the visitors landed and the last page they visited, so from here you can see which has more engagement.
(i)Site content – A detailed information about your content of each web-page.
– All Pages – It will show how your visitors interacted with all your webpages and its report like exit rate, bounce rate, page view and many other vital information. It will show you the top performing content.
– Content Drill-down – This analytic reports is unique!
Rather than showing all pages of your website, it groups them according to parent section or page path level and then you can drill down to the individual pages.
-landing pages – This Google analytic reports will give you information on all your landing pages, sessions, new sessions, bounce rate pages/session etc. You can check which are the top pages on which visitors enter your website and which pages can give your more conversions.
-exit pages – This Google analytic reports will give you information about the exits rate of your web-pages and the exit percentage along with showing the number of page views.
Exit pages are those web-pages which visitors last visited or the pages which visitors see before leaving your website.
(ii)site speed – In this google analytics guide you will help you identify areas of your website which needs optimization. You will get a clear idea about the page speed and it affects user behaviour.
-overview – A brief on average page loading time, redirection tine and many other information’s. In this overview you can see a summary of how fast each web-page is, of your website.
-Page timings – In this google analytics guide, you will find the average Page loading speed of your most visited web-page. It is always in the descending order which means your most visited page would be in the top and the least visited web-page would be in the bottom.
-speed suggestions – In this google analytics guide, it will provide suggestions from Google for your web-pages speed.
It shows your website pages: page speed score, average page loading time etc and how you can optimize it by optimizing suggested optimizations. Very useful reports.
-user timings –it gives you report on how long your visitors use your website.
It measures how fast specific elements on a page load and determine whether it affects the user experience or not.
To use it you need to add a custom code.
(iii)site search – I just love this report. In this google analytics guide you can see insights about the search queries of the search box. You can see what queries users have typed it in, in the search box. But before you have to turn it on.
-overview – It will basically analyse anything and everything that users have searched in your site’s search box. WOW!/
In this report, you can see many metrics like total unique search, search exits, time after search, percentage of search exits, average depth search etc.
-usage – It will breakdown between the visits that included an internal site search and those that did not.in simpler words, it will inform us number of visits where someone used the search-box versus number of visits where someone haven’t the search-box.
-search terms- these are the queries that visitors type in your search box. It will show you popular search terms your visitors use.
-search pages – this report breakdown those particular pages that visitors searched on your site.
(iv)events
-overview – a summary on total events, unique events
– top events- This will inform you about the top events which are taking frequently. Simple.
-pages – these are those pages which has generated most actions. You can see which of your post has generated the highest CTA.
– events flow – it tracks the flow or order of event on your website. For example – visitors click on the watch and then downloaded the pdf.
(v)Publishers – When you have monetized your website with Adsense, you can use
-overview
-publisher pages – In this google analytics guide, you can get information about the pages of your website that has generated high AdSense revenue. Some additional metrics that gives you some information about ads clicked, click through rate, revenue per thousand impressions.
-publisher referrers – it shows the referring URLs driving visitors to your site. This report helps you measure what traffic sources to focus on for increased earning.
(c)experiments – It allows you to have A/B testing.
5-Conversions report –(Google Analytic Reports)
This report is four sub divided reports:
(a)goals – It shows a quick summary on goal completions.
(i)overview – The goals report will show you how much goal completions have you done, with the goal value and goal conversion rate.
(ii) Goals URLs – Knowing your goal is not enough, you have to figure it out, what happened? This report will help you finding which pages or URLs of your website helped visitors to convert.
(iii)Reverse goal path – In this google analytics guide, it allows you to see the last three pages a user visited before completing your goal. WOW!
(iv)Funnel Visualisation – In this google analytics guide, you can see the goals when they are defined by the destination or pages.
It will show what amount of person has completed your goal and how many has left.
(b)E-commerce
(i)Overview – In this google analytics guide, it shows a summary report gives you an analysis of your website sales like the conversion rate, number of purchases, revenue, average order amount and quantity purchased, as well as the top revenue sources and your best sellers.
(ii)Product performance – This google analytics guide, tells you which products exactly your customers are buying, the quantities purchased, and the revenue generated by those products.
(iii)Sales performance – This google analytics guide, breakdown of your website’s sale performance by date so you can review the best and bad performing days.
(iv)Transaction –In this google analytics guide, you can see your total, tax, shipping and quantity information for each transaction.
(v)Time to purchase -In this google analytics guide, it gives you information into the average number of days and number of visits it takes your customers to make a purchase.
(c)Multi-channel funnels – In simple terms, it means how all your marketing channels are working to generate you sales through traffic.
(i)overview – It is a summary of number of conversions with the number of assisted conversions from the selected date range.
(ii)Assisted Conversions – In this analytic reports, it simply shows which sales or conversions each channel generated, assisted and completed.
(iii)Top Conversion Path – As the name goes, it will tell you about the most visited path which has generated the maximum conversions along with the other paths which has generated sales.
(iv)Time Lag- This is a interested report, it shows how long or days it takes your visited to get converted into conversions with prior to the first session of the visitor.
(v)Path length – In this analytic reports, it shows an easy view to the top most conversion paths or channels which drives you conversion.
It also gives information on how much interactions your visitors took to get converted.
(d)attribution – skip it
(i)Model comparison tool – skip it
ThAT'S A WRAP
Look understanding google analytics is not easy at all
I Hope you like our Google analytics guide blog.
By reading this Guide for Google analytics article you will learn google analytics fast.
If you have any doubts regarding any reports do comment us, we will try to explain to you!
Search engine optimization- Module 7
Before we get to know what is search engine optimization and how does it work.
Let us know what is search engines, types of search engines and why search engines are significant for business.
Social media optimization-Module 6
So we are going to start social media optimization from social media fundamentals.
SOCIAL MEDIA FUNDAMENTALS INCLUDE:
What is social media?
Initiation of Google analytics- Module 5
In this fifth module of initiation of google analytics, you will learn all about what is google analytics, how to set up account, the structure of google analytics why to use it, types of google analytics report etc.
Initiation of blogging-Module 4
Before we dive into digital marketing, let us know the meaning of blogging and how to use blogging for your business or as a career. A blog…
Meaning of video marketing- Module 3
Meaning of Graphic Design- Module 2
As we now know what is the meaning of the graphic design, how graphic designing works, the definition of graphic, types of graphic design, elements of graphic…
Introduction of digital marketing- Module 1
We must be aware of the history of digital marketing before diving into digital marketing. Nowadays digital marketing is shining like a crystal with growing opportunities…


Great content! Super high-quality! Keep it up! 🙂
Hiya, excellent website you’ve in here.
Excellent post! We will be linking to this great post on our website.
Keep up the good writing.
thank you kimber..
Thanks for one’s marvelous posting! I seriously enjoyed reading it,
you may be a great author.I will ensure that I bookmark your blog and will eventually come back someday.
I want to encourage you to ultimately continue your great work, have a
nice afternoon!
Excellent post. I was checking continuously this blog and I am impressed!
Very helpful information particularly the last part
🙂 I care for such info a lot. I was looking for this particular information for a very long time.
Thank you and good luck.
Thank you!
Hey there! This is my first visit to your blog!
We are a group of volunteers and starting a new initiative in a community
in the same niche. Your blog provided us valuable information to
work on. You have done a extraordinary job!
Thank you so muchh!!